Projects-Portfolio
Richard Seyeau
Data analytics, business intelligence, and IT service management professional. Open to remote and hybrid roles in data, AI, IT, and tech — including the Canadian federal government and data centre operations.

About
I work across the data lifecycle: cleaning and validating data, analysing it with statistics and machine-learning methods, and presenting it through dashboards and reports that non-technical stakeholders can act on. I hold professional certificates in data analytics (Google, IBM), statistics (Wolfram), Power BI (Microsoft), and ITIL 4 service management, and I keep building on that foundation through applied projects — the ones in this repo are documented, tested, and reproducible.
Skills
| Area | Skills |
|---|---|
| Data analysis | Exploratory analysis, data cleaning, transformation, validation, modelling, predictive analytics, regression |
| BI & reporting | Power BI, Tableau, Excel, IBM Cognos Analytics, dashboards, report writing, data storytelling |
| Programming & databases | Python, Pandas, NumPy, Polars, DuckDB, SQL, R, PostgreSQL, MySQL, MongoDB, GraphQL, Jupyter |
| Statistics & ML | Descriptive and inferential statistics, probability, hypothesis testing, ANOVA, regression, supervised and unsupervised learning, model interpretation |
| IT service management | ITIL 4 Foundation — service value system, governance, continual improvement |
| Data quality & governance | Metadata management, documentation, integrity checks, privacy-aware handling of information |
| Tools | Visual Studio Code, Git/GitHub, RStudio, Google Colab, Power Query, Microsoft Access |
Certifications
- Advanced Data Analytics Professional Certificate — Google, 2024–2025
- Statistics Foundations Professional Certificate — Wolfram Research, 2024
- Data Analytics Professional Certificate — Google, 2024
- ITIL 4 Foundation — AXELOS / PeopleCert, 2024
- Microsoft Power BI Data Analyst Professional Certificate — Microsoft, 2023
- Data Analyst Professional Certificate — IBM, 2023
- Programming certificates (Python, SQL, PostgreSQL, MongoDB, GraphQL, RDBMS, data science) — Programming Hub, 2019–ongoing
Experience highlights
- Owner/Operator, Keirstead Manor Bed & Breakfast (2017–2020) — ran daily guest operations and service delivery; built booking and guest-profile databases in Access, Excel, and Memento to track reservations and personalise service; maintained a 9.9/10 guest rating.
- Citizen-science classifier, Zooniverse (2024–ongoing) — classifies SuperWASP stellar light curves and reviews NGTS exoplanet-transit candidates: pattern recognition and time-series review on real scientific data.
Featured projects
| Preview | Project |
|---|---|
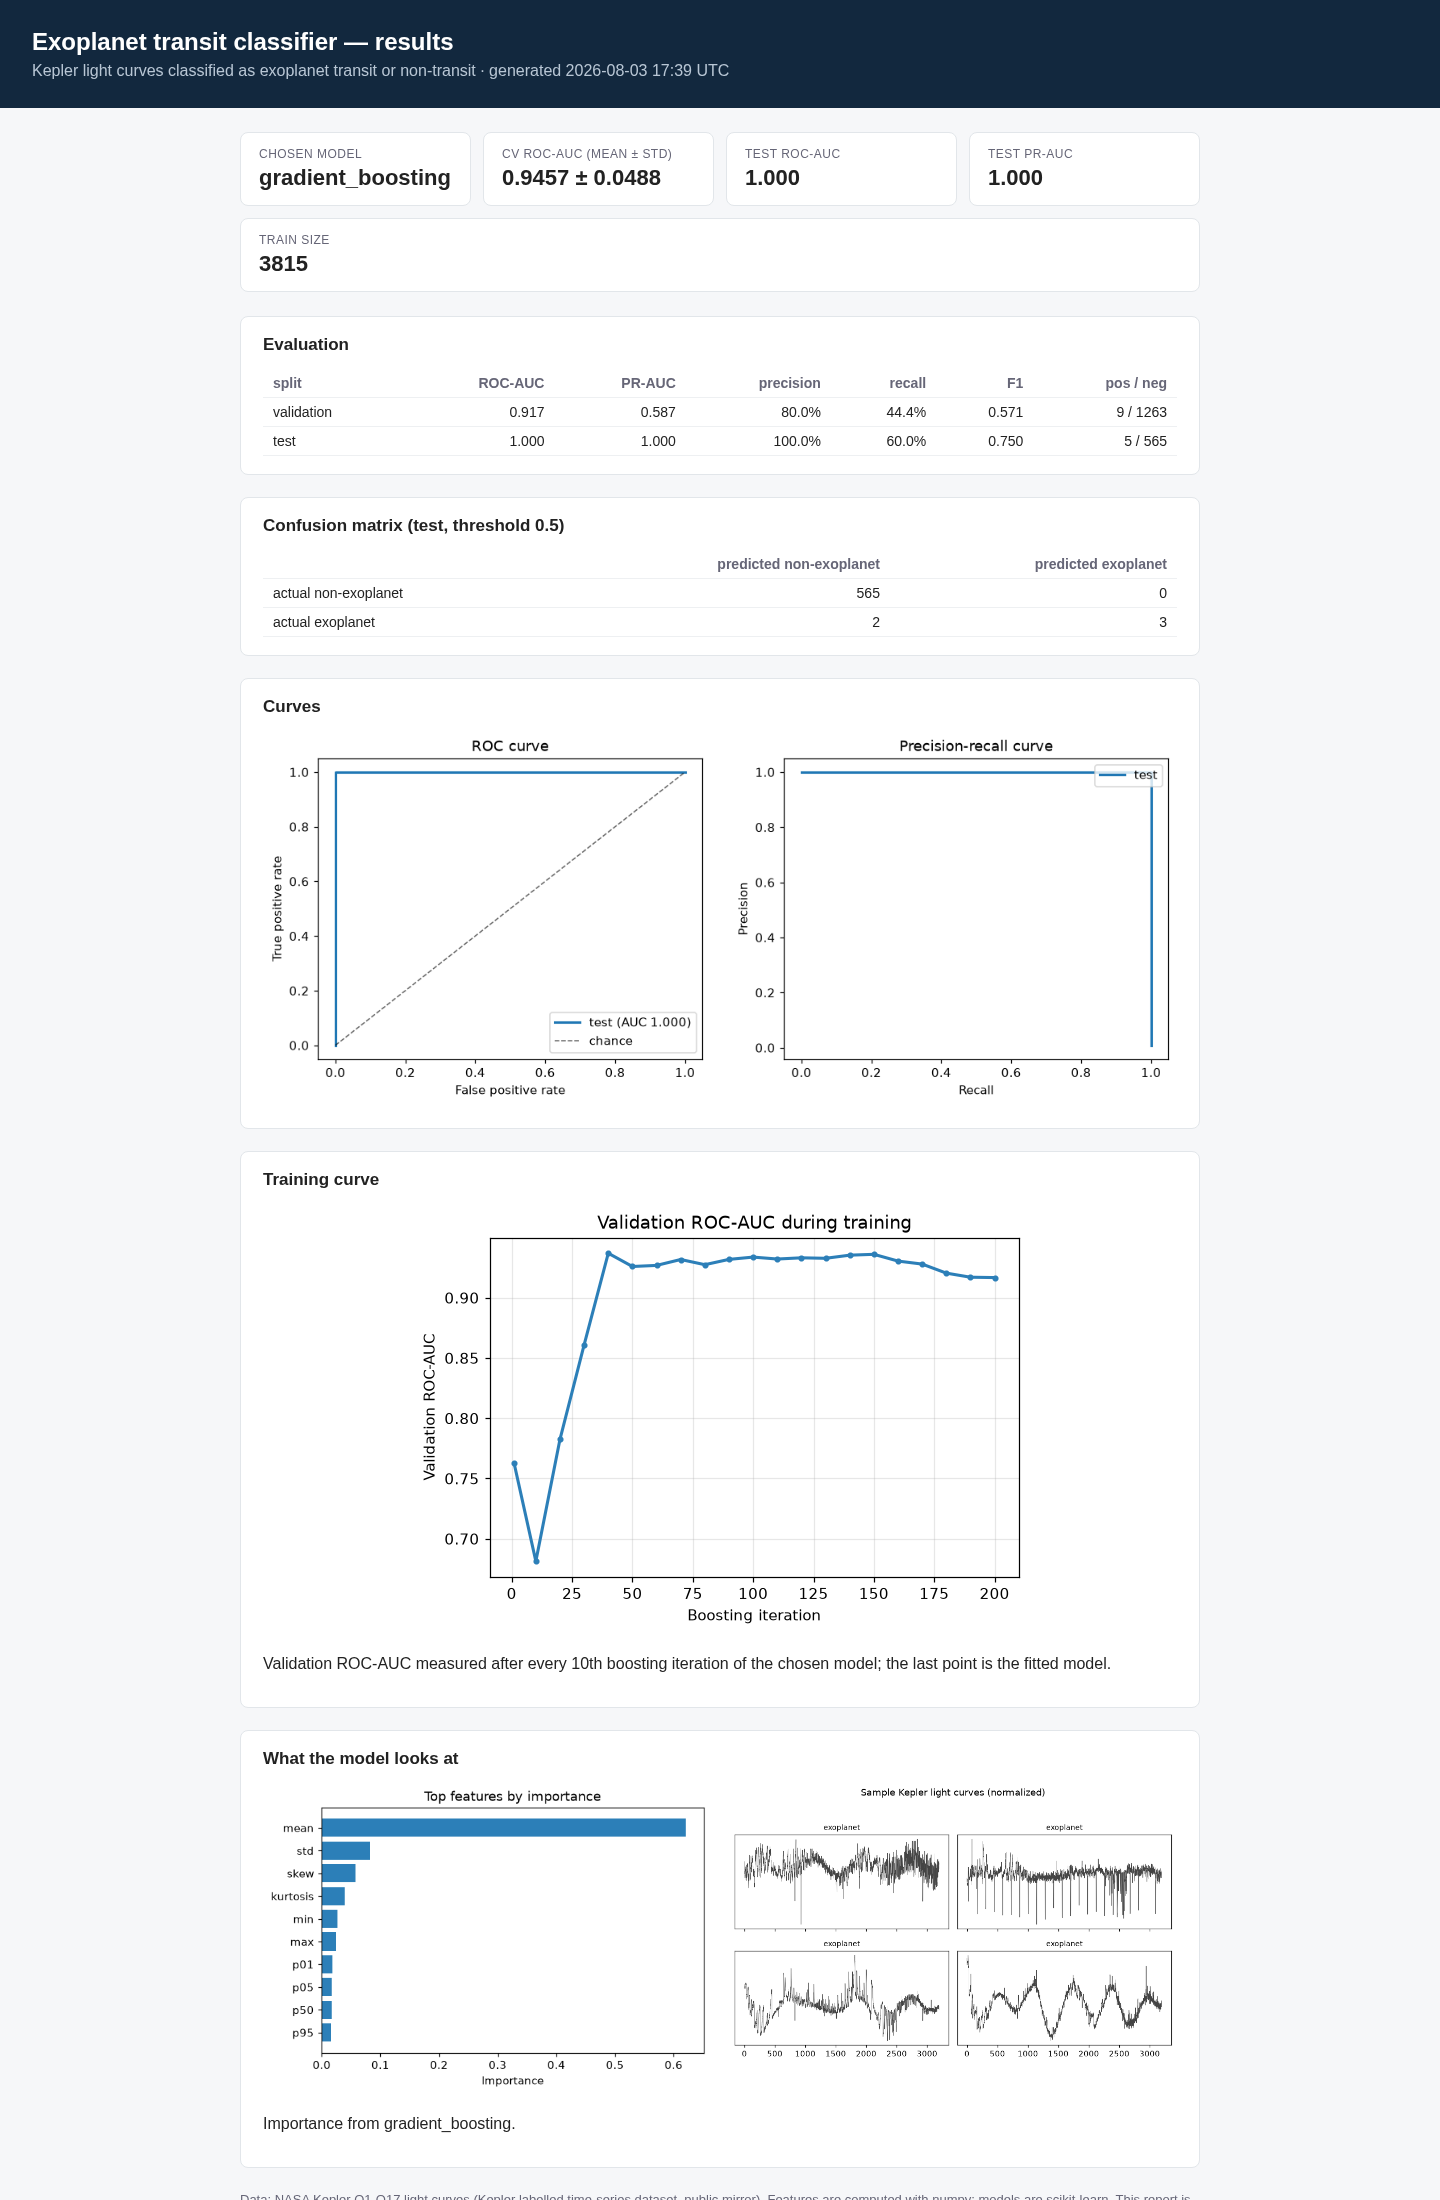 |
Exoplanet transit classifier — 0.946 cross-validated ROC-AUC on 5,000+ Kepler light curves, zero false positives on the held-out test set. The same transit-hunting pattern I do on Zooniverse, made reproducible. |
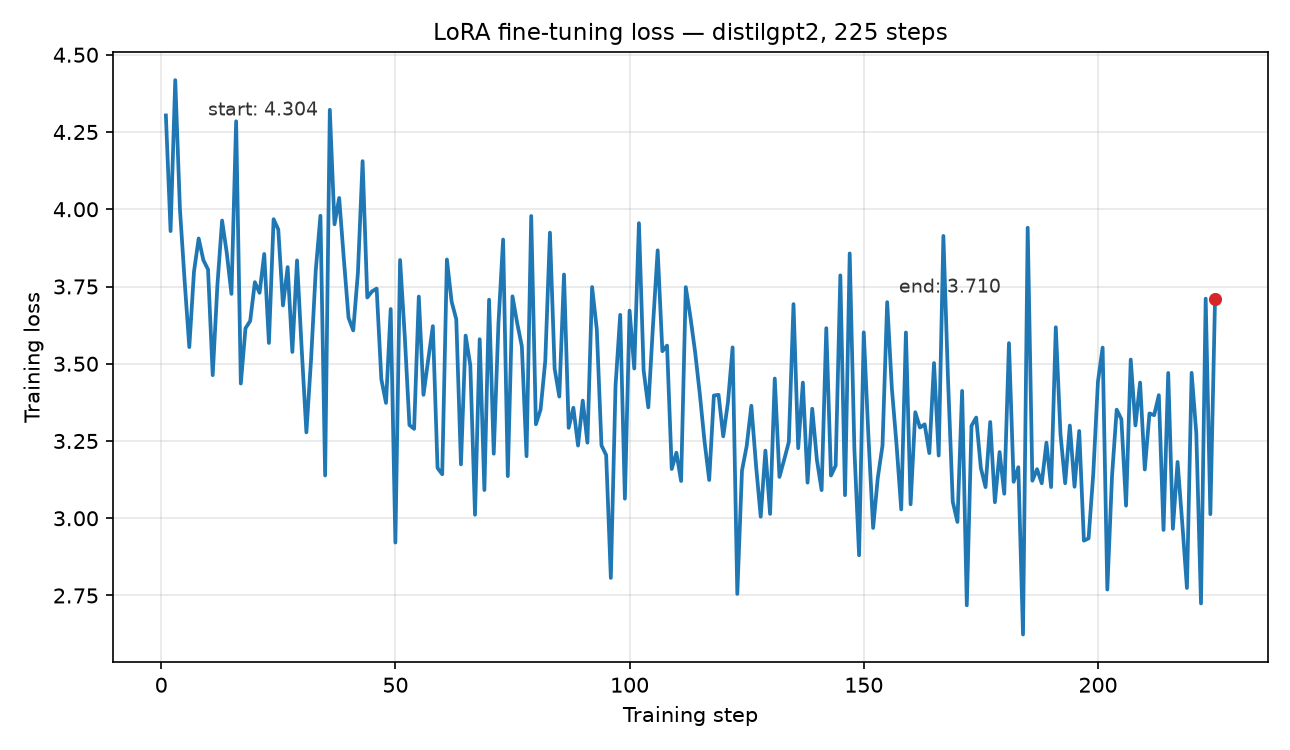 |
LLM fine-tuning workflow — LoRA fine-tuning on a laptop CPU, validation perplexity 41.4 → 22.8. Config-driven, tested, documented end to end. |
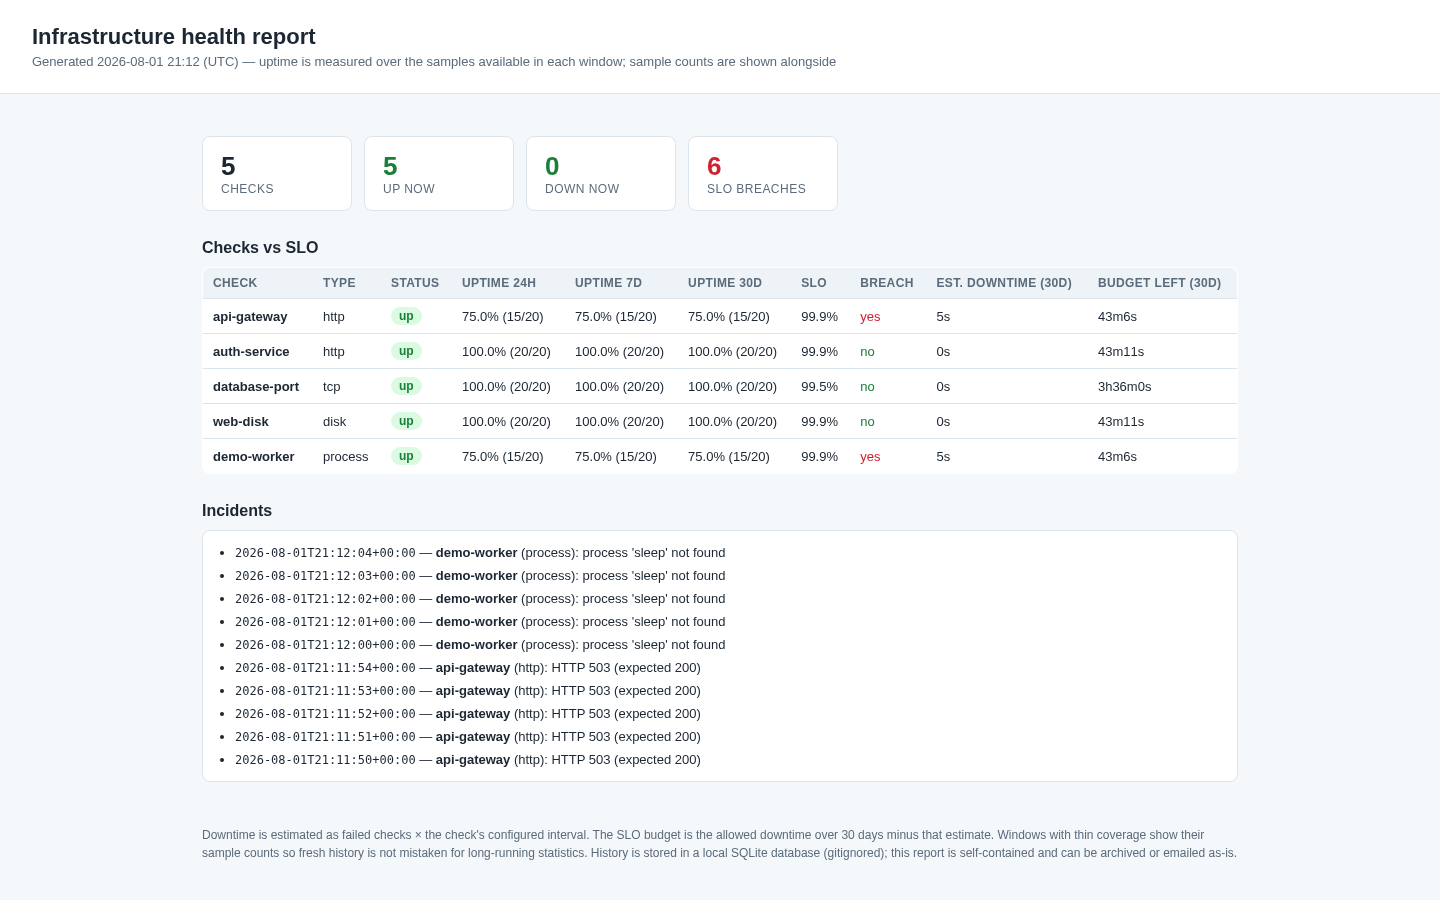 |
Infrastructure health monitor — SLO tracking with four check types, transition and breach alerts, self-contained HTML reports. Live demo caught a flaky service and a crashed worker. |
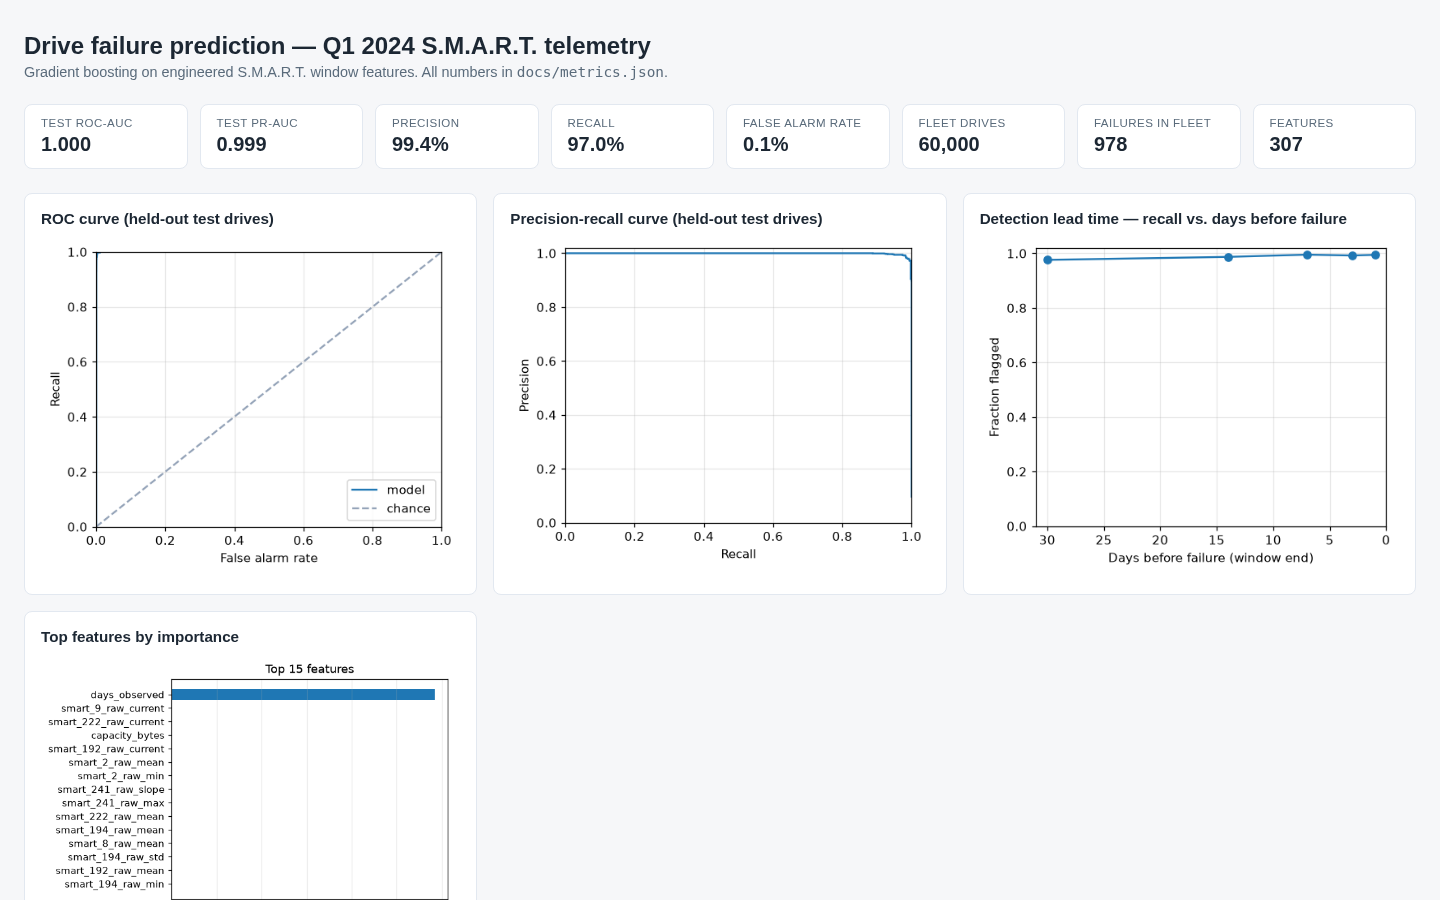 |
Disk failure prediction — flags drives at risk of imminent failure from S.M.A.R.T. telemetry: gradient boosting on a 60,000-drive sample of Backblaze’s real Q1 2024 data, 0.9999 held-out ROC-AUC, 0.994 precision / 0.970 recall, with recall above 0.98 up to 30 days before failure and an honest false-alarm analysis. |
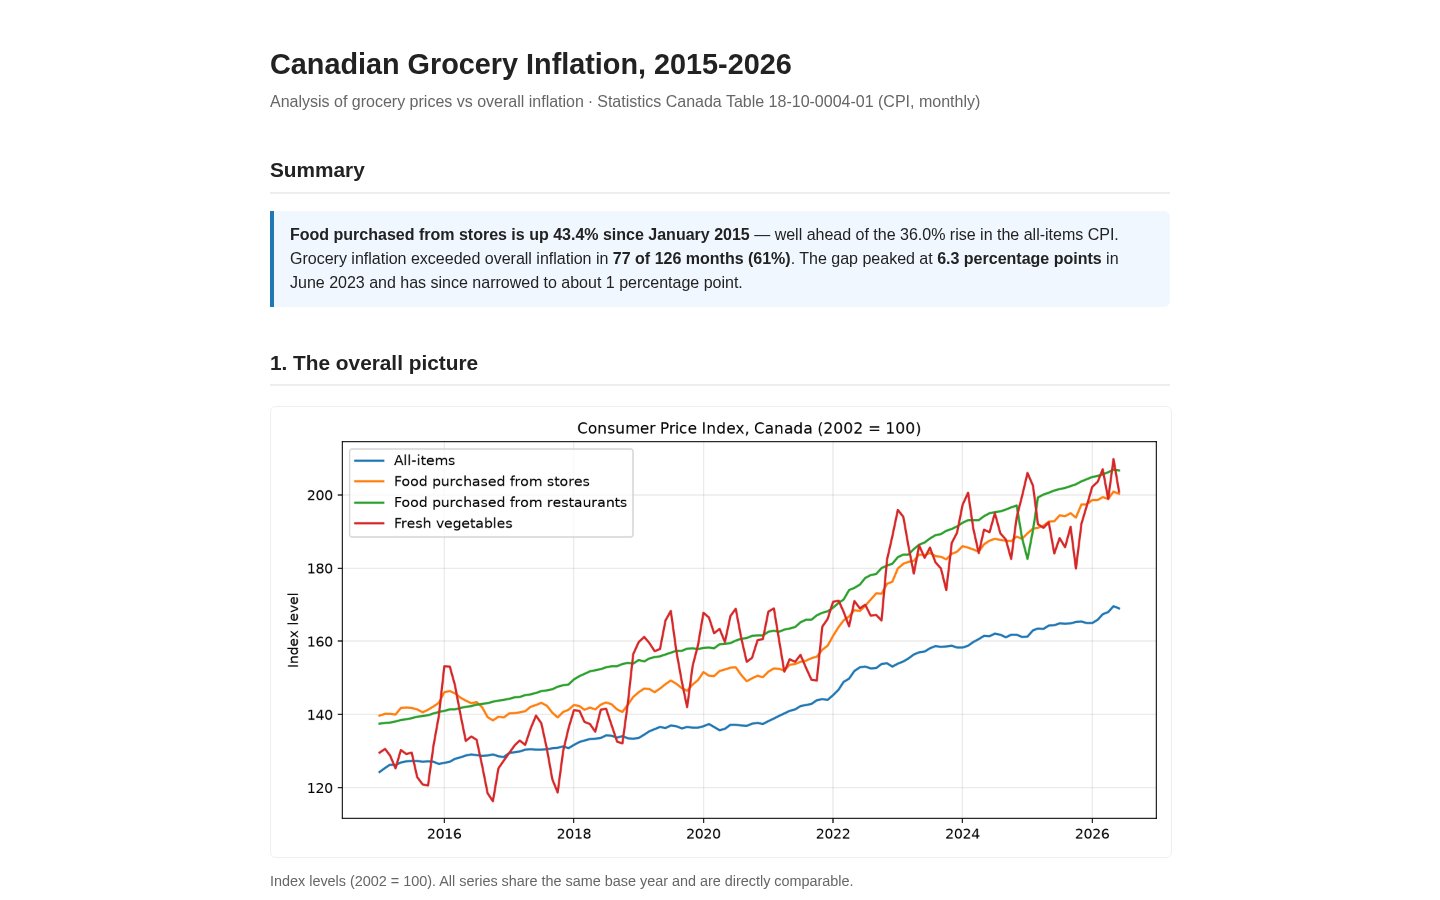 |
Canadian grocery inflation — ten years of StatsCan CPI data showing groceries outrunning overall inflation (+43.4% vs +36.0%), with an EDA notebook and self-contained dashboard. |
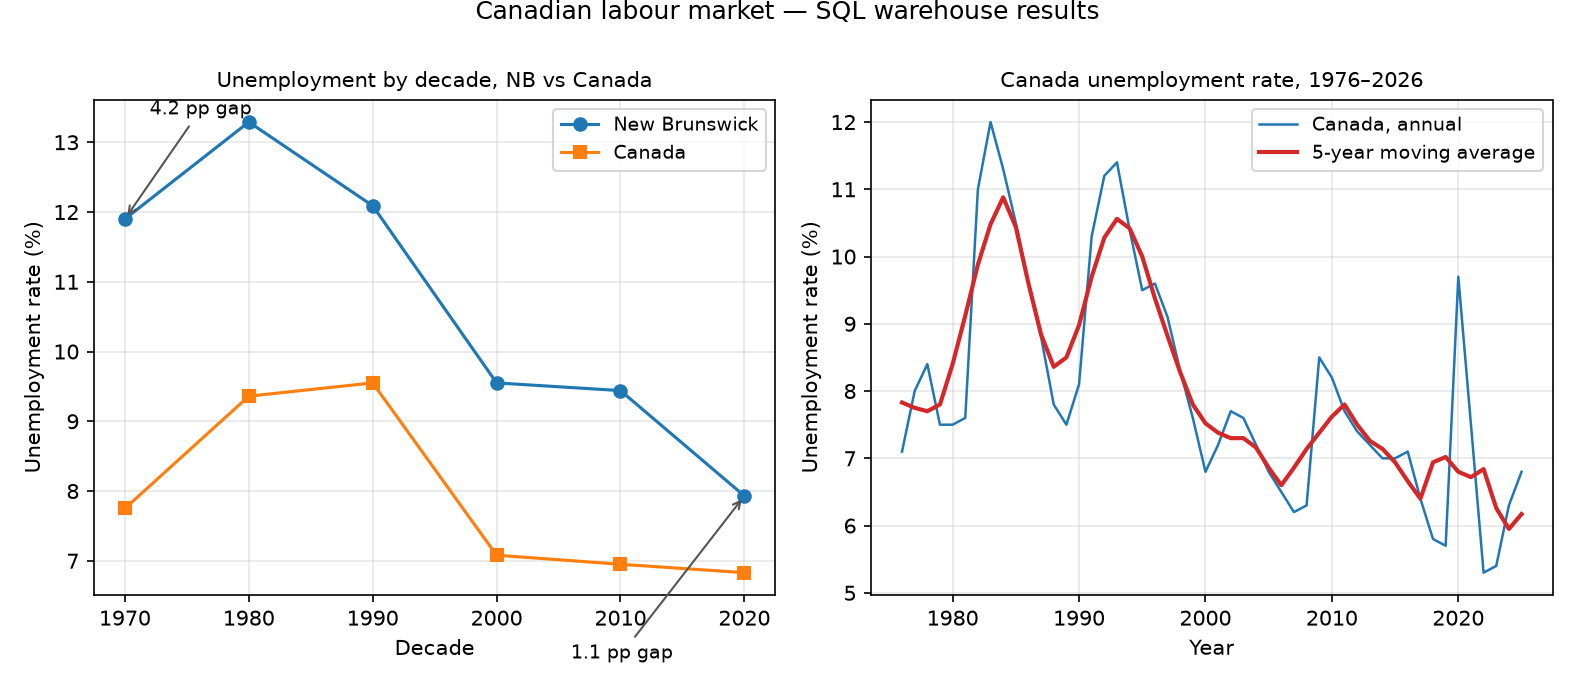 |
Canadian labour market analysis — Statistics Canada labour force and population tables normalized into a SQLite warehouse, answered through a 14-query SQL catalog. New Brunswick’s unemployment gap versus Canada narrowed from 4.2 pp (1970s) to 1.1 pp (2020s). |
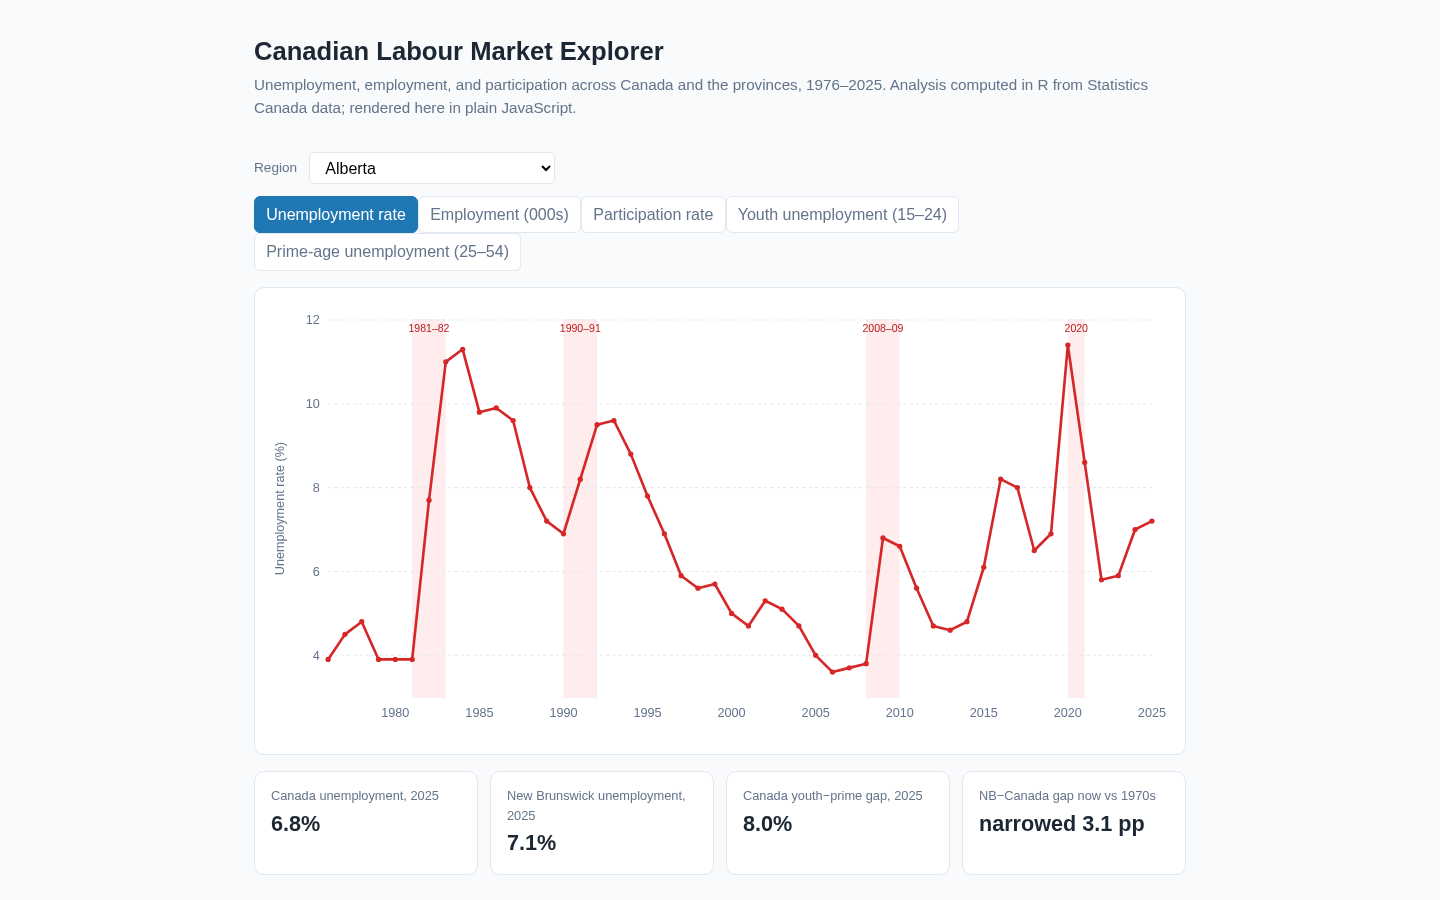 |
Canadian labour market explorer — the warehouse’s interactive companion: R computes 50 years of labour-market statistics and exports JSON; a zero-dependency JavaScript dashboard renders them with region and metric switching, recession shading, and hover readouts. Live on GitHub Pages. |
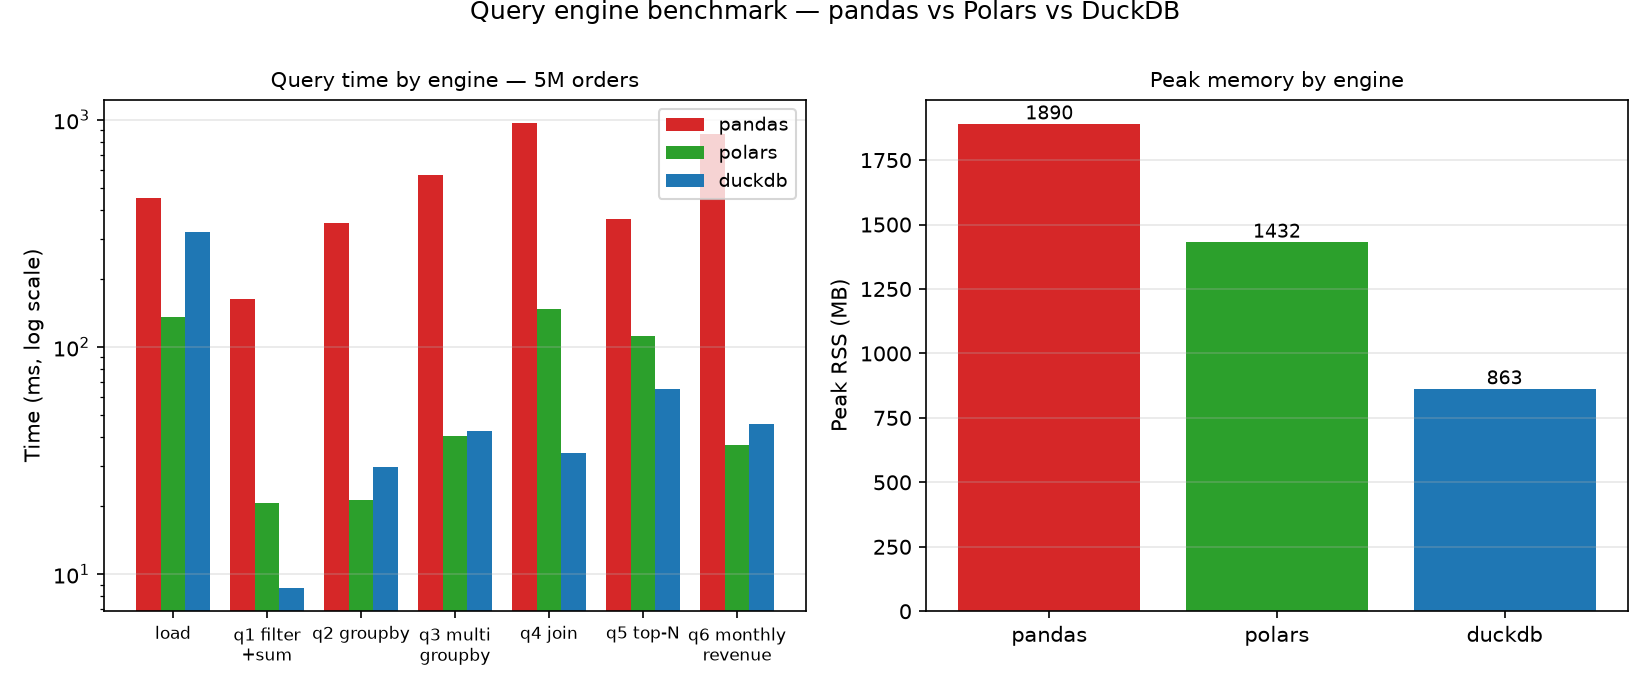 |
Query engine benchmark — pandas, Polars, and DuckDB on 5M orders with cross-engine result verification. DuckDB was 5–28× faster than pandas on most queries with ~2.2× less peak memory; Polars won load time and group-bys. |
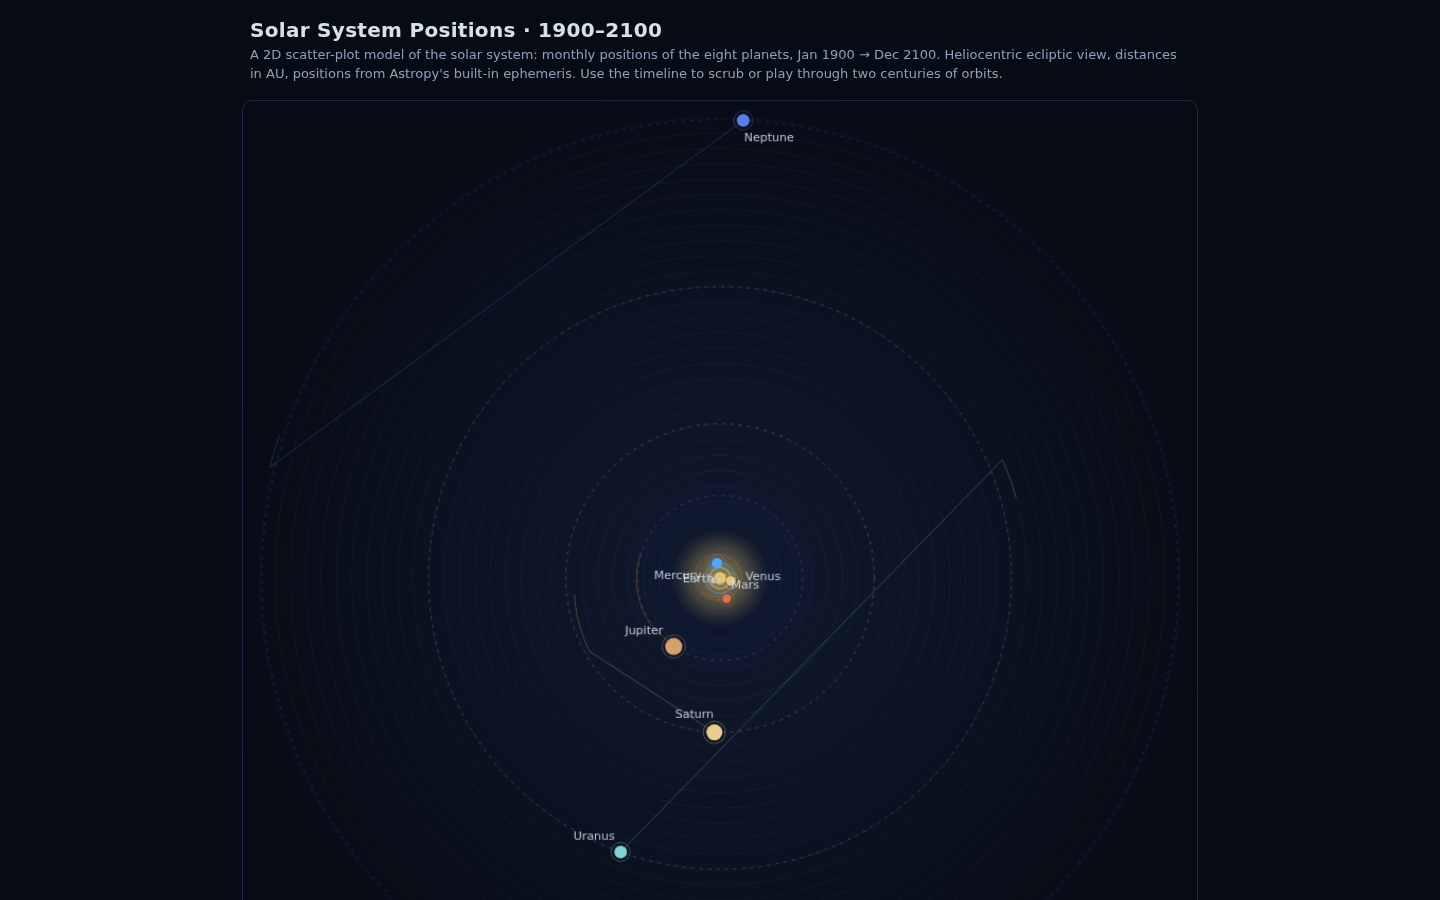 |
Solar system positions viewer — an interactive 2D scatter-plot model of the solar system: every planet’s position for every month 1900–2100, computed with Astropy’s built-in ephemeris and viewable as a self-contained HTML timeline on GitHub Pages. |
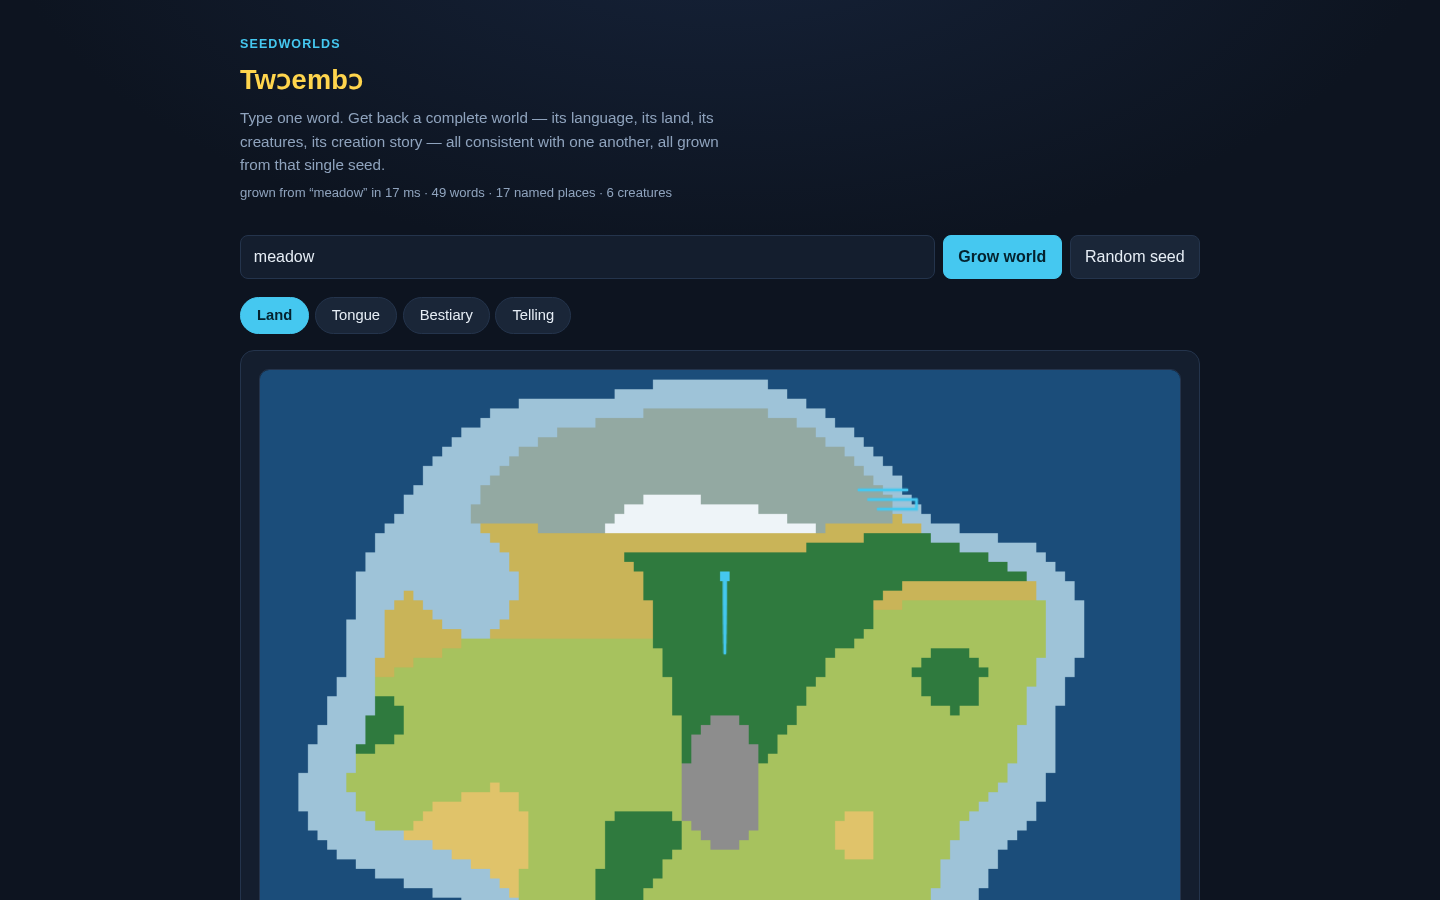 |
Seedworlds — one word grows an entire world: a constructed language, a map with biomes and rivers, six creatures, and a creation myth — all consistent with each other and deterministic from the seed, so the same word always grows the same world. Pure client-side JavaScript, live on GitHub Pages. |
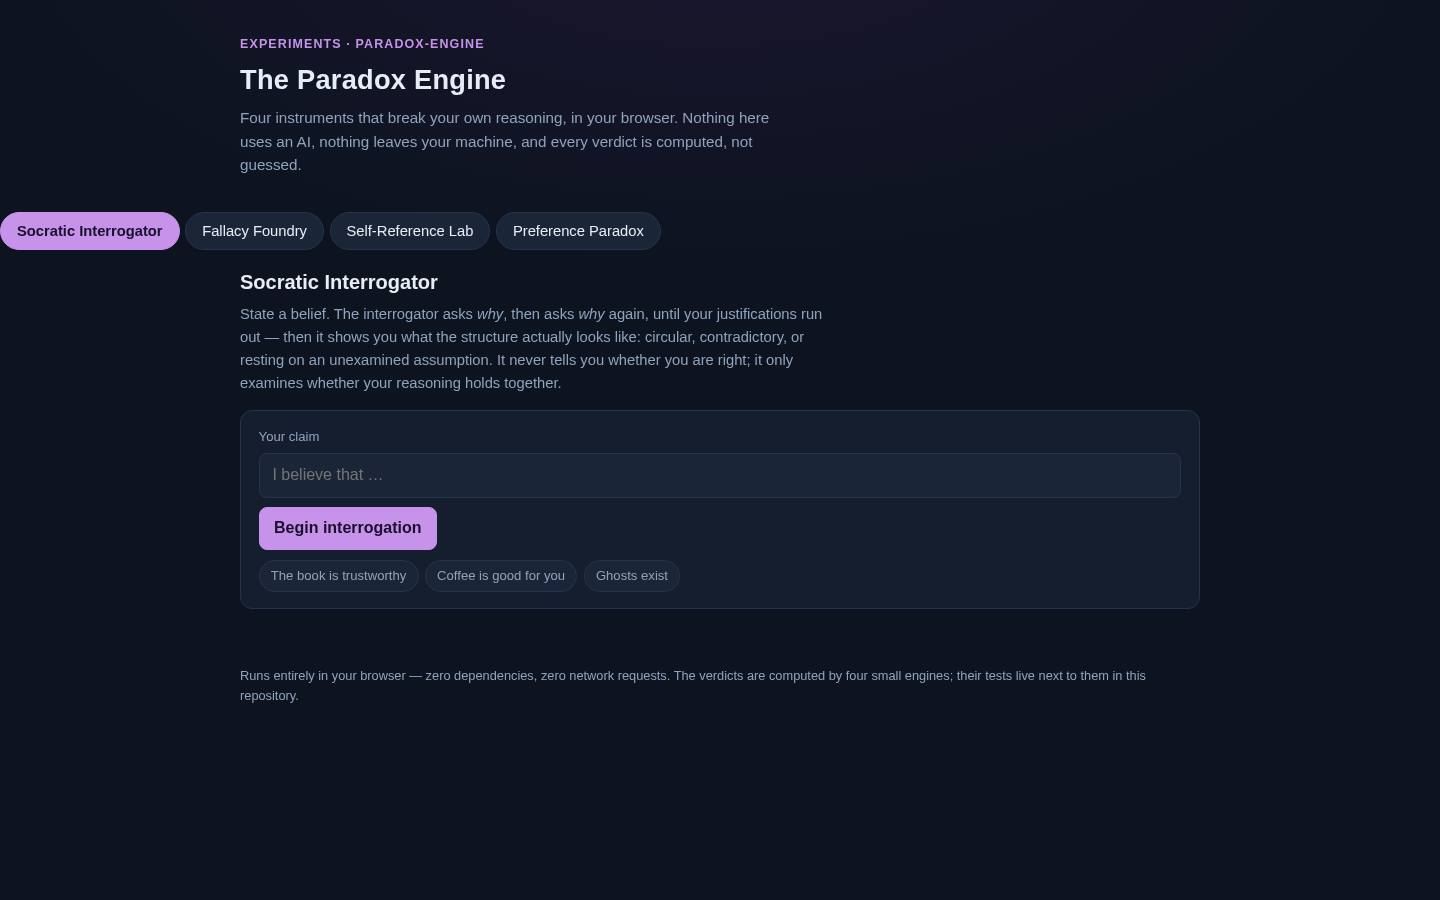 |
Paradox Engine — four browser instruments that break your own reasoning: an interrogator that builds justification trees and flags circularity, a fallacy foundry that highlights twelve classic fallacies inline, a Kripke-style self-reference lab that evaluates networks of self-referential sentences (the liar → PARADOX), and a preference lab that catches Condorcet cycles in your own pairwise choices. Pure client-side JavaScript, live on GitHub Pages. |
Repo layout
| Folder | Contents |
|---|---|
data/ |
Data pipelines, analysis, and reporting — Canadian grocery inflation project, Canadian labour market analysis, Canadian labour market explorer |
ai-ml/ |
Machine learning and AI applications — LLM fine-tuning workflow, exoplanet transit classifier |
it-ops/ |
Infrastructure, automation, and operations — infrastructure health monitor, disk failure prediction |
experiments/ |
Prototypes, tools, and personal projects — query engine benchmark, solar system positions viewer, seedworlds, paradox engine |
docs/ |
Project standards and skills matrix |
Contact
- LinkedIn: linkedin.com/in/richard-w-seyeau
- GitHub: github.com/Richard-WS