Projects-Portfolio
Canadian Grocery Inflation (2015-2026)
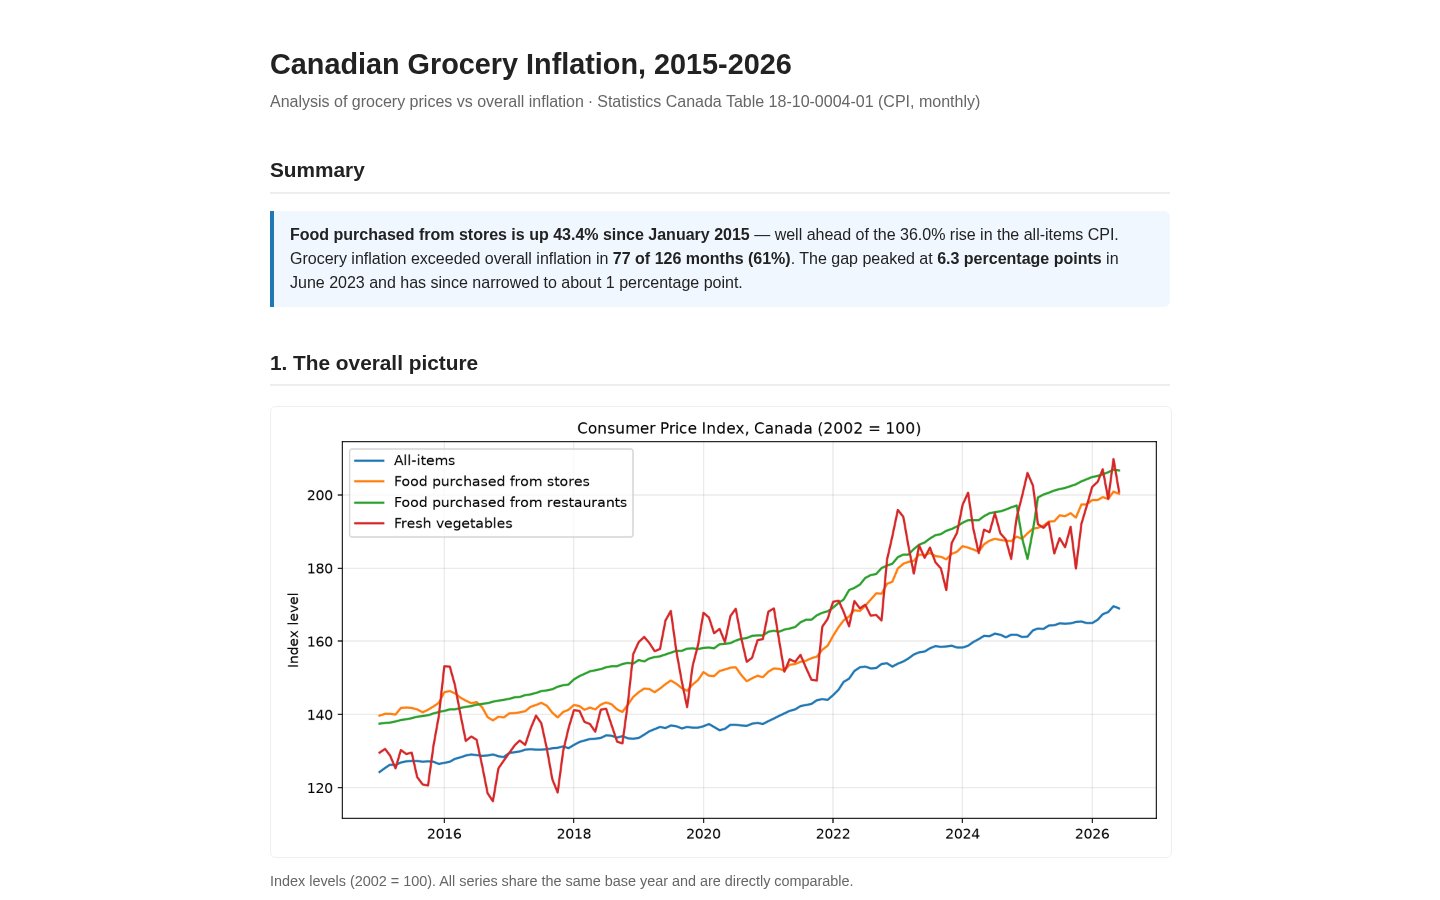
How food prices have moved compared to overall inflation in Canada over the past decade — using official Statistics Canada data.
The finished dashboard is live on GitHub Pages: docs/dashboard.html.
Dataset
- Source: Statistics Canada, Table 18-10-0004-01 — Consumer Price Index, monthly, not seasonally adjusted
- Scope: Canada, selected product groups, index base 2002=100 (so series are directly comparable), January 2015 – June 2026
- Raw data: the full table dump is ~160 MB (all geographies/products/base years) — downloaded to
data/raw/(gitignored); the processed subset is committed atdata/processed/cpi_canada_food_2015_2026.csv
Key findings
| Metric | Value |
|---|---|
| Grocery-store inflation (Jan 2015 → Jun 2026) | +43.4% |
| All-items CPI over same period | +36.0% |
| Months groceries outran all-items | 77 / 126 (61%) |
| Widest gap | 6.3 pp (June 2023) |
| Gap now | ~1 pp |
| Regression slope (food vs all-items YoY) | 1.44 (r² = 0.54) |
Grocery prices have structurally outrun the overall basket — and every 1 percentage point of general inflation has come with ~1.4 points of grocery inflation. Fresh vegetables (+55%) were the fastest riser; the 2021–2023 spike drove the gap to its peak.
Reproduce
python -m venv .venv && source .venv/bin/activate
pip install -e ".[dev,report]"

# 1. Download the raw table (once)
curl -L -o data/raw/18100004.zip https://www150.statcan.gc.ca/n1/tbl/csv/18100004-eng.zip
unzip -o data/raw/18100004.zip -d data/raw/

# 2. Regenerate the processed dataset
python scripts/make_processed.py

# 3. Run the analysis
python scripts/run_eda.py

# 4. Rebuild charts + dashboard
python scripts/make_charts.py
python scripts/make_dashboard.py

# 5. Tests
pytest
Contents
| Path | What it is |
|---|---|
data/processed/cpi_canada_food_2015_2026.csv |
Tidy dataset (date, product, value, yoy) |
notebooks/01_food_inflation_eda.ipynb |
EDA notebook (same analysis as run_eda.py) |
scripts/make_processed.py |
Raw → processed pipeline |
scripts/run_eda.py |
Command-line EDA |
scripts/make_charts.py |
Chart generation (matplotlib) |
scripts/make_dashboard.py |
Self-contained dashboard HTML |
docs/dashboard.html |
The report — single-file, opens in any browser |
docs/charts/ |
Standalone PNGs |
src/foodinflation/ |
Load/clean/analysis library (unit-tested) |
Notes
- The raw StatsCan file has a UTF-8 BOM;
load_rawhandles it. pandasis pinned to>=2.2,<3because pandas 3.0.5 has a chunked-reader bug that crashes on this large CSV (IndexErrorinusecols). Verified locally.- YoY values are NaN for the first 12 months of each series (no prior-year comparison) — that’s the 60 “missing” values reported in the EDA.