Projects-Portfolio
Canadian Labour Market Explorer
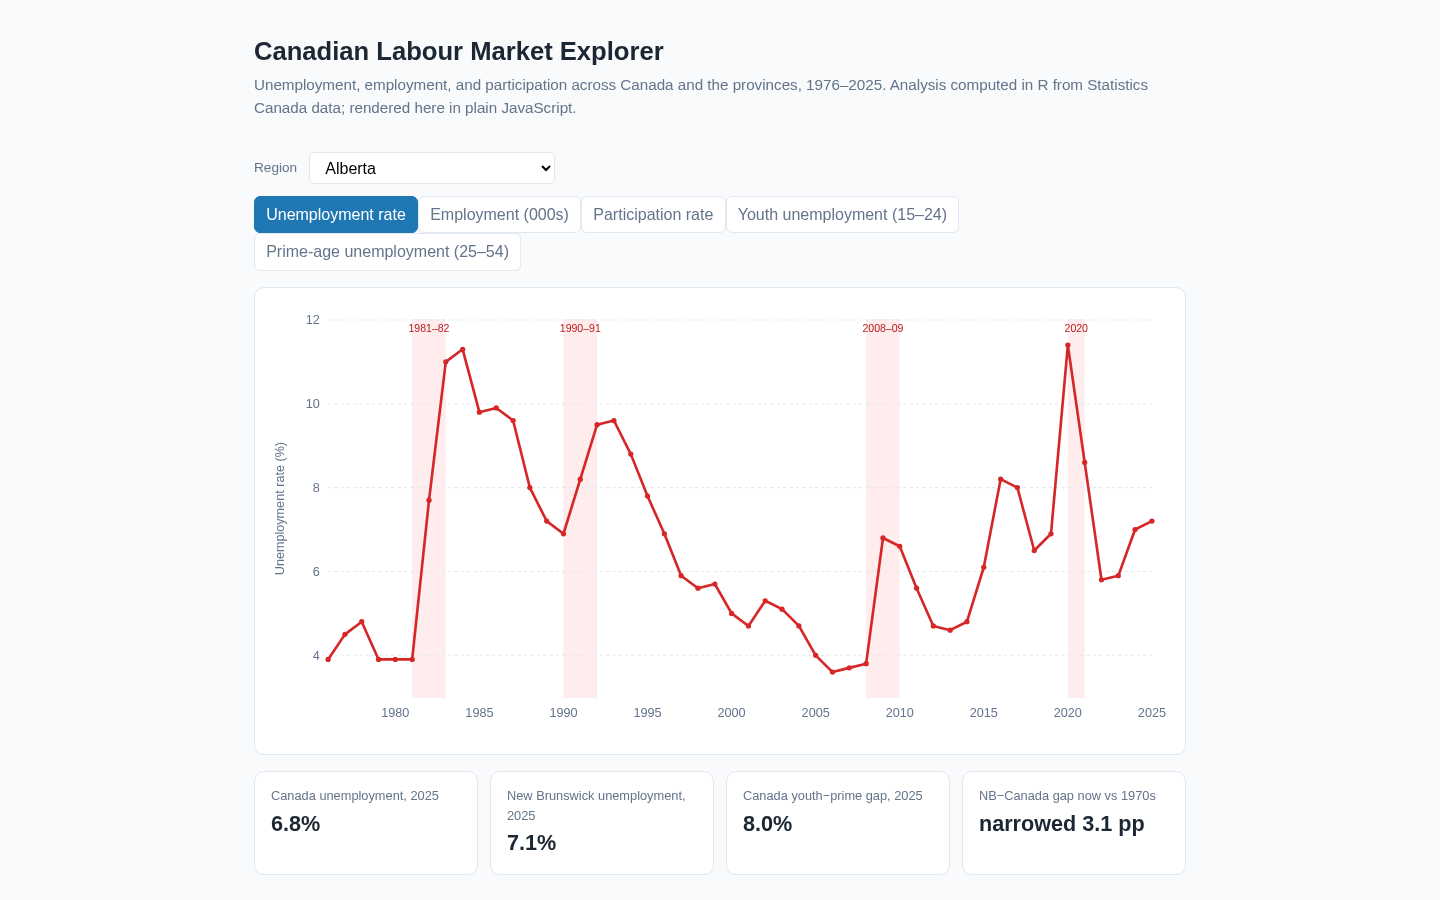
An interactive dashboard of Canadian labour-market statistics, 1976–2025. R computes the analysis, plain JavaScript renders it — no frameworks, no build step, no external libraries.
Live demo: richard-ws.github.io/Projects-Portfolio/data/canadian-labour-market-explorer/dashboard/
What it shows
- Unemployment, employment, participation, and youth vs prime-age unemployment for Canada and all ten provinces, every year since 1976.
- Recession shading (1981–82, 1990–91, 2008–09, 2020) so downturns are visible at a glance.
- The New Brunswick–Canada unemployment gap by decade — the headline story: the gap narrowed from 4.2 percentage points in the 1970s to 1.1 points in the 2020s.
How it works
data/samples/labour_market_annual.csv   committed sample (550 rows: 50 years x 11 regions)
        │  R analysis (R/analysis_functions.R + R/analyze.R)
        ▼
docs/results/data.json                  dashboard payload (regions, decades, trends, highlights)
docs/results/charts/*.png               report charts (base R graphics)
        │
        ▼
dashboard/index.html + app.js           interactive SVG chart, zero dependencies
The sample CSV was extracted from the project’s SQLite warehouse
(../canadian-labour-market-analysis), which normalizes Statistics Canada
Table 14-10-0327-01 (labour force characteristics). The R side performs
the real analysis: decade averages, the NB–Canada gap, youth vs prime-age
gaps, employment indexing, and per-region linear trends, exported as JSON.
Reproduce
# Analysis (regenerates docs/results/)
Rscript R/analyze.R

# Tests — R (testthat) + JavaScript (node:test)
bash scripts/test.sh
R dependencies are intentionally minimal: base R + jsonlite + testthat (no tidyverse), so the pipeline runs anywhere R is installed.
Data and licence
Data: Statistics Canada, Table 14-10-0327-01, Labour force characteristics by province, annual. Used under the Statistics Canada Open Licence. This is a derivative work; the source tables remain the authoritative record.
Notes
- Recession intervals are conventional business-cycle markers (1981–82, 1990–91, 2008–09, 2020), used for visual context only.
- The dashboard loads
docs/results/data.jsonat runtime, so it works on GitHub Pages or any static file server — no server-side logic.