Projects-Portfolio
Canadian Labour Market Analysis
A SQLite data warehouse of Statistics Canada labour-market statistics, with a repeatable ETL pipeline and a catalog of 14 analytical SQL queries.
Why this matters: unemployment and employment rates are headline numbers behind federal and provincial labour policy. This project takes the raw long-format CSVs Statistics Canada publishes, normalizes them into a clean star-schema warehouse, and answers real policy questions in pure SQL — from “how deep was the 2008 recession dip” to “how far has New Brunswick’s unemployment rate sat above the national average, by decade”.
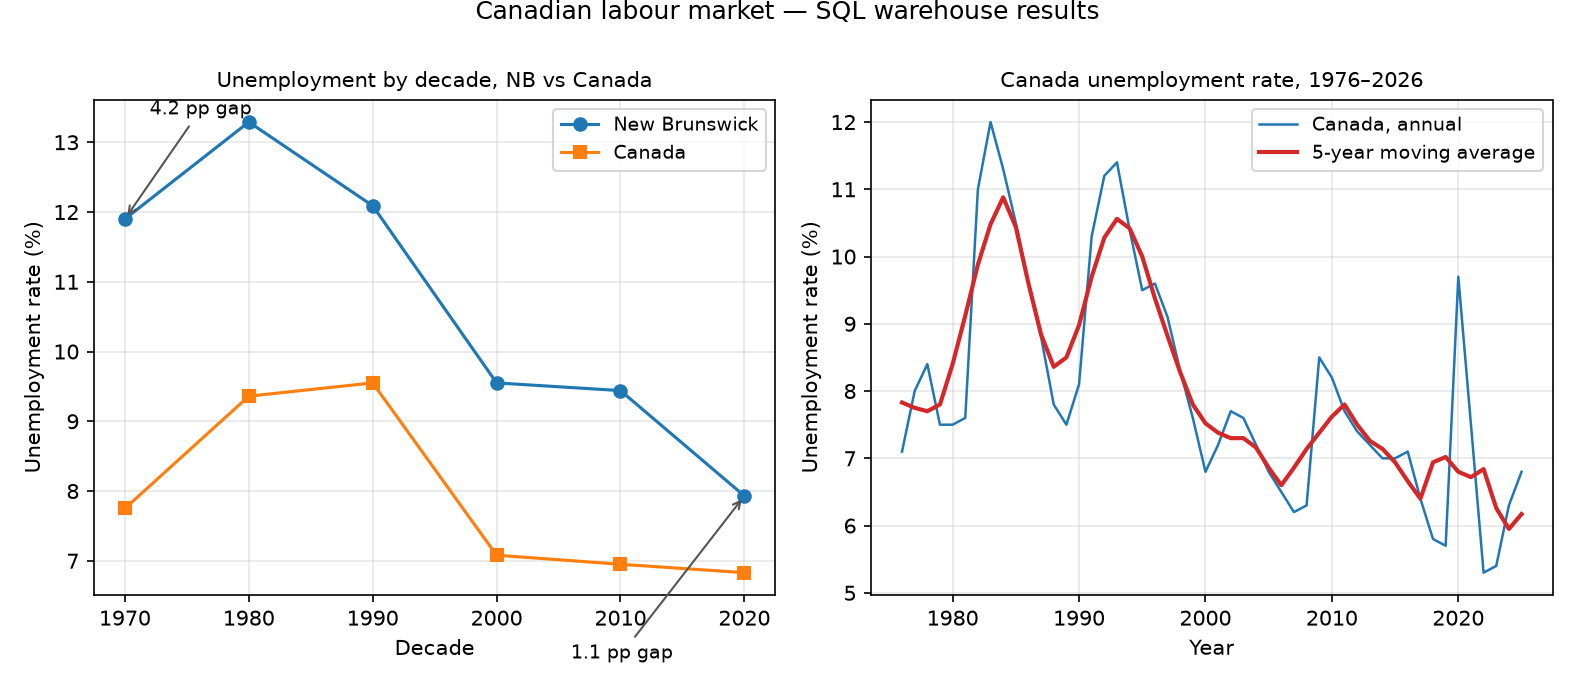
Regenerated from the committed query results by scripts/make_chart.py.
Problem
StatsCan’s downloadable tables are long, wide, and inconsistently formatted: every row carries a geography name, gender label, age group, characteristic name, unit, and value — with suppressed cells as empty values. Analysts repeatedly filter, rename, and rejoin the same columns. This project turns that raw shape into a reusable, queryable warehouse so the analysis step is pure SQL.
Approach
- Data: Statistics Canada tables 14-10-0327-01 (labour force characteristics by province, annual) and 17-10-0005-01 (population estimates by age and gender, July 1). Released under the Statistics Canada Open Licence.
- Pipeline:
scripts/download_data.shfetches the official CSVs →python -m canlab buildruns a pandas ETL (BOM handling, geography name → region code, gender normalization, suppressed-row drop, population filtered to joinable age groups) → builds the SQLite warehouse by executing the committed schema and view files verbatim. - Warehouse: star schema —
regions,age_groups,sexdimensions;labour_forceandpopulationfact tables; analytical views (v_unemployment_rate,v_employment,v_employment_per_capita,v_part_time_share). - Query catalog: 14 named queries in
sql/03_analytics.sql, covering window functions (moving average, year-over-year growth), CTEs, pivots, decade bucketing, and cross-table joins. Run any of them withpython -m canlab query <name>.
Results
| Query | Question it answers | Highlights |
|---|---|---|
q02_unemployment_by_province_latest |
Which provinces had the highest / lowest unemployment in the latest year? | NL 10.1% vs SK 5.2% |
q06_recession_2008_recovery |
How deep was the 2008-09 dip, how long to recover? | Employment fell 1.4% from its 2008 peak, back above it in 2011 |
q07_covid_shock_2020 |
Which provinces lost and regained the most jobs in 2020-2021? | All provinces down in 2020; five back above their 2019 level by 2021 |
q08_nb_vs_canada_unemployment |
How far has NB sat above the national average, by decade? | Gap narrowed from 4.2 pp (1970s) to 1.1 pp (2020s) |
q10_employment_per_working_age |
Jobs per 1,000 working-age people, 1976 vs 2025? | Ontario 671 → 761 per 1,000 |
q12_youth_unemployment |
Youth vs prime-age unemployment, and has the gap narrowed? | Youth rate ~2× prime-age, gap widens in downturns |
Full outputs for all 14 queries are in docs/results/.
Validation: Canada’s 2024 annual unemployment rate in the warehouse is 6.3%, against the published 6.4% (tolerance-tested in CI).
Repository layout
sql/                  schema, views, and the 14-query analytics catalog
src/canlab/           ETL, warehouse builder, query runner, CLI
configs/example.yaml  table IDs, paths, query list (paths resolve to the project)
data/samples/         committed normalized samples (2020-2025) for a demo build
data/raw/             downloaded StatsCan CSVs — gitignored, reproducible
docs/results/         CSV output of every catalog query on the full dataset
scripts/              download_data.sh, build_database.py, make_chart.py
tests/                59 hermetic tests (fixtures, schema, golden values, all queries)
Getting started
# 1. Reproduce the data (optional — samples ship in the repo)
scripts/download_data.sh

# 2. Build the warehouse from the committed samples (offline demo)
python -m canlab build --samples

# 3. Or build from the full raw CSVs
python -m canlab build

# 4. Explore
python -m canlab list              # the 14-query catalog
python -m canlab query q08_nb_vs_canada_unemployment
python -m canlab run-all           # dump every query to docs/results/
Requires Python 3.10+; install with pip install -e ".[dev]". No API keys,
no secrets — the pipeline hits only public Statistics Canada endpoints.
Tests
59 hermetic tests (no network): ETL on tiny fixture CSVs, schema and constraint enforcement, golden values hand-computed from the fixtures, and a test that every catalog query runs and returns expected rows.
python -m pytest
Licence
Data © Statistics Canada, used under the Statistics Canada Open Licence. Code in this project is available for reuse; see the portfolio project standards.