Projects-Portfolio
Query Engine Benchmark
A head-to-head comparison of the three Python analytics engines I reach for most often — pandas, Polars, and DuckDB — on the same realistic workload: a multi-million-row retail dataset and six queries that show up in real reporting work (filters, group-bys, a join, top-N, monthly rollups).
I keep seeing “pandas is slow, use X” takes online, most of them backed by micro-benchmarks on toy data. This project is my attempt to get honest numbers on a dataset shaped like the ones I actually query: load time, per-query timings, and peak memory, with every engine forced to return the same answers before any timing is taken seriously.
Problem
- pandas is the default, but its performance degrades badly as tables grow; Polars and DuckDB are the modern challengers. Each makes different trade-offs (expression engine vs. SQL, lazy vs. eager, in-process vs. query-plan).
- Benchmarks online are usually single-query micro-tests that don’t reflect how analytics work is actually written — load the data, filter, group, join, sort, roll up.
- “Faster” is meaningless unless the results are the same. Any comparison that doesn’t verify output equivalence is measuring two different things.
Approach
- Synthetic dataset (seeded, reproducible): 5,000,000 orders across
200,000 customers — categories, regions, prices, quantities, dates, and a
customer table with tiers for the join. Generated chunk-by-chunk so it
never needs to exist in memory at once; raw files land in
data/raw/(gitignored), a 2,000-row sample is committed underdata/samples/. - Six representative queries, each written natively for its engine —
pandas idioms, Polars expressions, and SQL for DuckDB:
q1_filter_sum— total revenue, one regionq2_groupby— revenue by categoryq3_multi_groupby— count / avg price / total qty by region × categoryq4_join— orders × customers, revenue by tierq5_topn— top 10 customers by spendq6_monthly_revenue— revenue by month
- Equivalence gate: before timing, every engine runs every query on a 50k-row slice of the real dataset and the outputs are compared pairwise (floats within 1e-6). The tests enforce the same guarantee on every run.
- Timing: each engine runs in its own subprocess (so peak memory is
measured cleanly via
ru_maxrss), each query times best-of-3 after one warmup run, and the median is reported. - Artifacts: per-engine timings and peak memory in
docs/benchmark-results.csv, the chart indocs/screenshot.png(scripts/make_chart.py), this README’s results table, and a summary printed to the console.
Results
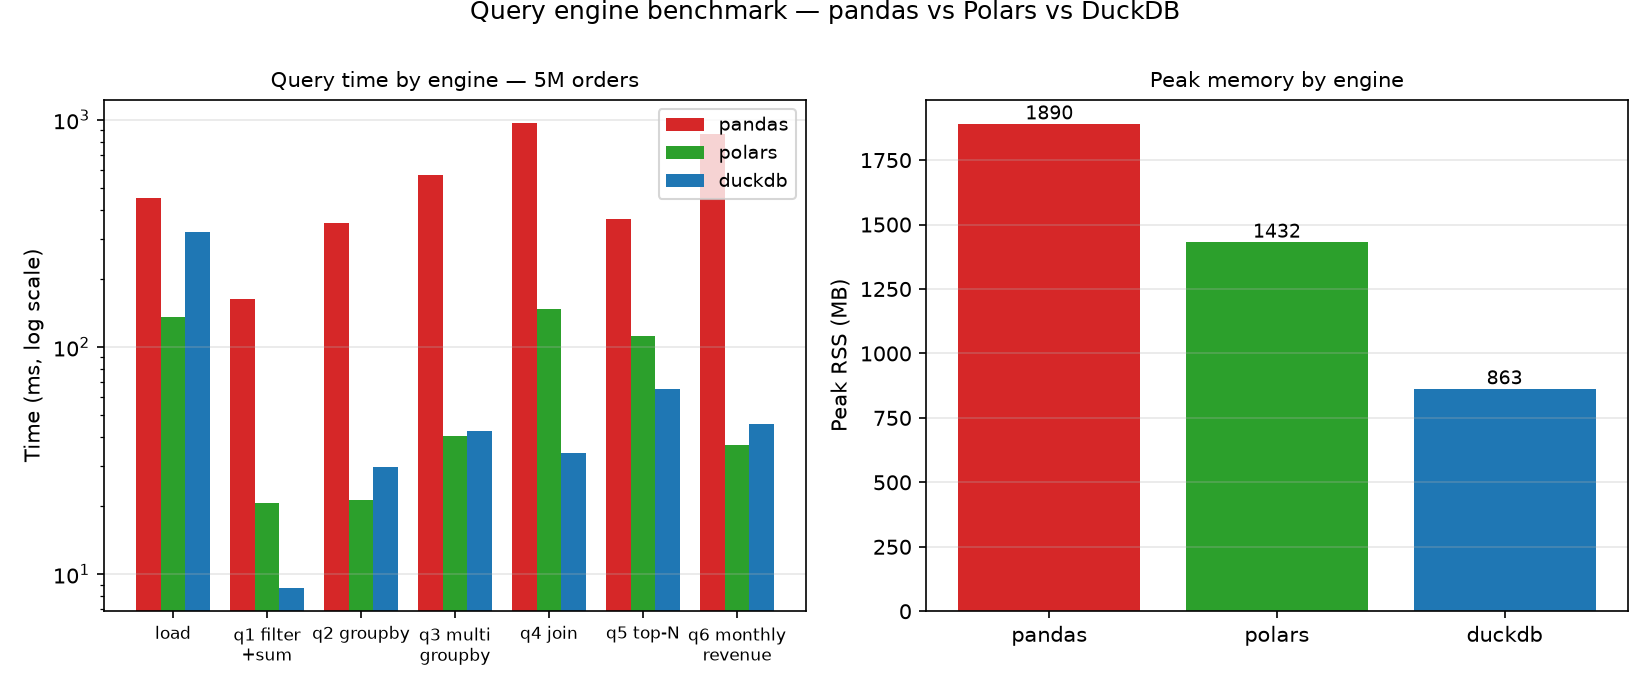
Dataset: 5,000,000 orders × 200,000 customers (parquet), best-of-3 median wall time after one warmup run. Every engine returned identical results on every query — verified on a 50k-row slice before timing, with the same equivalence check enforced by the test suite on every run. Machine: single machine, 10 GB RAM.
| Engine | Load (ms) | q1 | q2 | q3 | q4 | q5 | q6 | Peak mem (MB) |
|---|---|---|---|---|---|---|---|---|
| pandas | 451 | 162 | 352 | 570 | 970 | 365 | 870 | 1,891 |
| Polars | 136 | 21 | 21 | 41 | 146 | 112 | 37 | 1,432 |
| DuckDB | 319 | 9 | 30 | 43 | 34 | 65 | 46 | 863 |
Raw timings: docs/benchmark-results.csv.
The short version:
- DuckDB was fastest on the filter (q1), the join (q4), and top-N (q5) — and used the least memory overall: 863 MB peak vs pandas’ 1,891 MB, about 2.2× less. A simple SQL aggregate over big tables is exactly what it was built for.
- Polars won the group-bys (q2, q3) and the monthly rollup (q6), and loaded the parquet files fastest (136 ms vs pandas’ 451 ms).
- pandas was 5–28× slower on every query. The gap is widest on the join (970 ms vs 34 ms) and the monthly rollup (870 ms vs 37 ms) — the operations that force it to move data around.
- Loading the data is cheap for all three; the differences are in query execution, which is where analytical work actually spends its time.
Caveats, stated plainly: one machine, one synthetic dataset, medians of three runs. Real workloads mix in user-defined functions, string-heavy data, and out-of-core cases where the pandas ecosystem and Polars’ lazy API change the picture. The point of this experiment was to replace “I heard X is faster” with numbers I can reproduce — the config and scripts are committed so anyone can re-run it on their own data.
Reproduce
python -m venv .venv && source .venv/bin/activate
pip install -e '.[dev]'

# 1. Generate the dataset (5M rows, ~200 MB on disk)
python scripts/generate_data.py -c configs/example.yaml

# 2. Verify equivalence + run the benchmark, write docs/benchmark-results.csv
python scripts/run_benchmark.py -c configs/example.yaml

# Smaller/faster runs
python scripts/generate_data.py -c configs/example.yaml --rows 500000
python scripts/run_benchmark.py -c configs/example.yaml --rows 500000

# Tests (hermetic — tiny synthetic data, no network)
python -m pytest -q
Project layout
query-engine-benchmark/
├── configs/example.yaml        # all knobs: dataset size, queries, runs
├── data/
│   ├── raw/                    # generated orders/customers (gitignored)
│   └── samples/                # committed 2,000-row samples (seed 42)
├── src/querybench/
│   ├── config.py               # YAML config + numeric-string coercion
│   ├── data.py                 # seeded chunked dataset generator
│   ├── queries.py              # 6 queries x 3 engines + equivalence checks
│   ├── bench.py                # median timing + peak RSS helpers
│   └── runner.py               # per-engine subprocess runner (JSON out)
├── scripts/
│   ├── generate_data.py        # write dataset + samples
│   └── run_benchmark.py        # verify, time all engines, write results
├── docs/benchmark-results.csv  # committed raw results
├── docs/screenshot.png         # chart of the results (scripts/make_chart.py)
└── tests/                      # 64 hermetic tests, incl. cross-engine equality