Projects-Portfolio
Infrastructure Health Monitor
A small, config-driven monitoring tool that checks whether your services are up, keeps a record of every result, and tells you whether you’re actually meeting your availability targets. No agents to install, no vendor account — just Python and a YAML file.
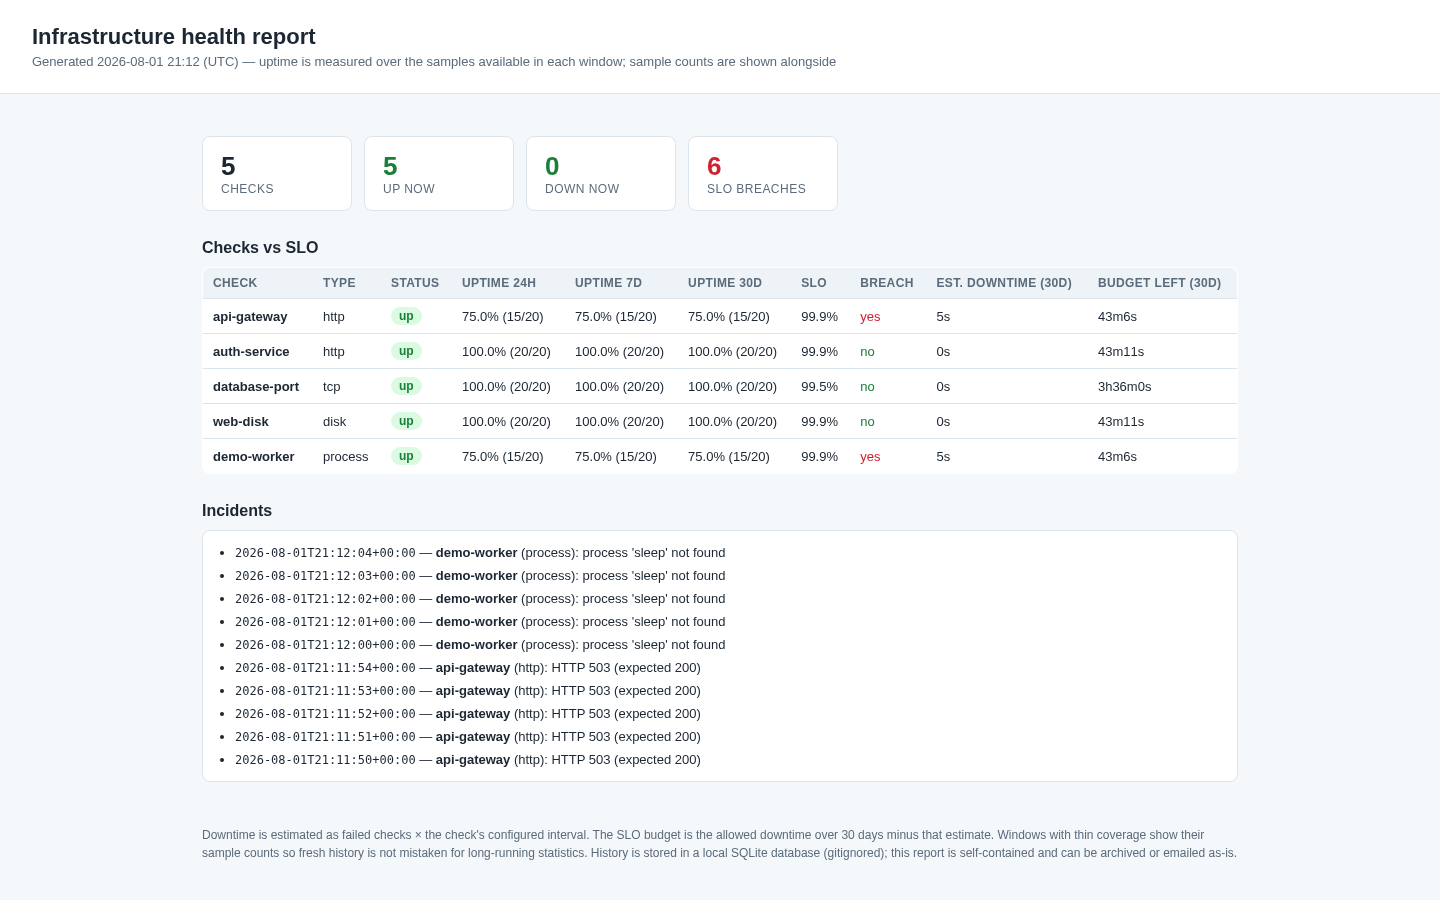
The demo report is live on GitHub Pages: docs/demo-report.html.
Problem
Most monitoring stacks are heavyweight for what small teams actually need: a few services, a couple of servers, one SLA commitment. Standing up an agent-based platform with a web dashboard is a lot of moving parts when the question is often just “is it down, and how long was it down?”
There’s also a gap between “the site is up right now” and “we met our availability commitment.” Monitoring tools report the former; meeting an SLO like 99.9% requires tracking history, computing uptime over rolling windows, and watching the downtime budget — not just a green/red light.
Approach
The tool is a single Python package built around four moving pieces:
- Checks — four types, all standard library: HTTP(S) (status code, optional body text, latency), TCP (can you connect to the port), disk (usage vs critical threshold), and process (is it running, via
/proc). - History — every result is written to a local SQLite database with a timestamp, latency, and a human-readable detail line.
- SLO math — uptime is computed per check over rolling 24h / 7d / 30d windows from the history. A check is in breach when its uptime drops below the SLO configured for it, and the report shows estimated downtime (failed checks × check interval) against the 30-day budget
(1 − SLO) × 30d. - Alerts — the monitor logs on every state transition (
DOWN/RECOVERED) and on SLO breaches, and optionally POSTs the same payload to a generic webhook. Check state persists in a small JSON file, so a cron-driven setup doesn’t re-alert on every run.
Three commands cover the workflow: check runs everything once and exits non-zero if anything is down (cron-friendly), run loops forever respecting each check’s own interval, and report prints a summary or exports a self-contained HTML report and the raw history as CSV.
The tests run against real localhost servers (a healthy endpoint and one that fails its first few requests), so the suite exercises the actual network paths without needing anything external.
Results
The demo in scripts/run_demo.py spins up five local targets — a healthy API, a flaky one (503s for its first five requests), a TCP listener, the project’s own disk, and a worker process that is deliberately killed and restarted partway through — then runs 20 rounds of checks. The monitor caught both incidents:
[DOWN] api-gateway (http): HTTP 503 (expected 200)
[SLO_BREACH] api-gateway (http): HTTP 503 (expected 200) — uptime 0.0% below the 99.9% SLO (24h window, 0/1 passes)
[RECOVERED] api-gateway (http): HTTP 200 in 6ms
demo: worker process stopped (simulating a crash)
[DOWN] demo-worker (process): process 'sleep' not found
[SLO_BREACH] demo-worker (process): process 'sleep' not found — uptime 90.9% below the 99.9% SLO (24h window, 10/11 passes)
demo: worker process restarted
[RECOVERED] demo-worker (process): process 'sleep' is running
Final summary from the same run:
| Check | Type | Status | Uptime 24h | SLO | Breach | Est. downtime (30d) |
|---|---|---|---|---|---|---|
| api-gateway | http | up | 75.0% (15/20) | 99.9% | yes | 5s |
| auth-service | http | up | 100.0% (20/20) | 99.9% | no | 0s |
| database-port | tcp | up | 100.0% (20/20) | 99.5% | no | 0s |
| web-disk | disk | up | 100.0% (20/20) | 99.9% | no | 0s |
| demo-worker | process | up | 75.0% (15/20) | 99.9% | yes | 5s |
Both incidents were flagged the moment they happened, both SLO breaches were called out, and both checks had recovered by the end of the demo. The full sample history is committed at data/samples/demo-history.csv (100 rows) and the generated report at docs/demo-report.html — open it in any browser.
Quick start
python -m venv .venv && source .venv/bin/activate
pip install -e ".[dev]"

# 1. Point the example config at your own services
cp configs/example.yaml config.yaml   # edit to taste

# 2. Run every check once (exit 1 if anything is down — ready for cron)
infra-health check -c config.yaml

# 3. Run continuously, respecting each check's interval
infra-health run -c config.yaml

# 4. Summarize the history; export a report and the raw rows
infra-health report -c config.yaml
infra-health report -c config.yaml --html docs/report.html --csv data/samples/history.csv

# 5. Tests
pytest
Optional alert webhook: set ALERT_WEBHOOK_URL (see .env.example) and every alert is POSTed as JSON, e.g.
{"alert": "DOWN", "check": "api-gateway", "type": "http", "ts": "2026-08-01T21:11:50+00:00", "detail": "HTTP 503 (expected 200)"}
Contents
| Path | What it is |
|---|---|
configs/example.yaml |
Annotated example config (http, tcp, disk, process) |
src/infra_health/ |
Package: checks, history, state, alerts, monitor, report, CLI |
scripts/run_demo.py |
Live demo against local servers; regenerates the sample data and report |
data/samples/demo-history.csv |
Sample history from the demo run (committed) |
docs/demo-report.html |
Self-contained HTML report from the demo run (committed) |
tests/ |
60 pytest tests, hermetic (localhost servers, temp dirs) |
Notes
- Relative paths in the config resolve against the config file’s directory, so the monitor can run from anywhere.
- Process checks read
/proc(Linux). Match the name as shown byps -o comm=— the kernel truncates it to 15 characters. - Downtime is estimated as failed checks × the check’s configured interval — an approximation, not second-level truth.
- Report windows show sample counts next to uptime, so thin history is never mistaken for long-running statistics.
- Timestamps are UTC. The SQLite history and state file live under
data/raw/(gitignored); only the sample export and report are committed.