Projects-Portfolio
Exoplanet Transit Classifier
A machine-learning pipeline that decides whether a Kepler light curve shows a planet transiting its star (the periodic dip in brightness that happens when a planet passes in front of it) or not. It takes raw Kepler photometry, turns each 2048-point light curve into a compact feature vector, and trains a classifier to separate exoplanet transits from the noise, flares, and instrumental artifacts that dominate the sky.
This is the same pattern-recognition problem I work on as a volunteer classifier on Zooniverse, where citizen scientists mark transit candidates in SuperWASP and NGTS data — here it is made reproducible and automated.
The classification report is live on GitHub Pages: docs/classification-report.html.
Problem
- Kepler watched 150,000+ stars; most light curves contain no planet, and the ones that do hide a signal of ~1% or less of the star’s brightness.
- Labeling every curve by eye is not scalable — and automated vetting has to distinguish real, periodic transits from non-transit variability (stellar flares, pulsations, instrument drift).
- Can a simple, explainable model — trained on real labeled light curves — reliably tell the two apart, and where does it fail?
Approach
- Data: the public Kepler labelled time-series dataset (Q1-Q17 light
curves: 5,087 training curves, 570 test curves, labels
exoplanet/non-exoplanet). Raw CSVs are downloaded intodata/raw/(gitignored). - Features: each curve is median/MAD-normalized, then detrended with a rolling median to remove slow instrumental drift, then summarized with 420 features: a full autocorrelation grid (400 lags — periodic transits show a strong correlation bump at the transit period), plus shape statistics, dip morphology, and FFT summaries. The raw grid is kept intact so the tree model can find the relevant lags itself.
- Models: a balanced logistic regression baseline vs. gradient boosting, compared on a stratified validation split; the winner is scored once on the held-out official test set and reported with cross-validated ROC-AUC.
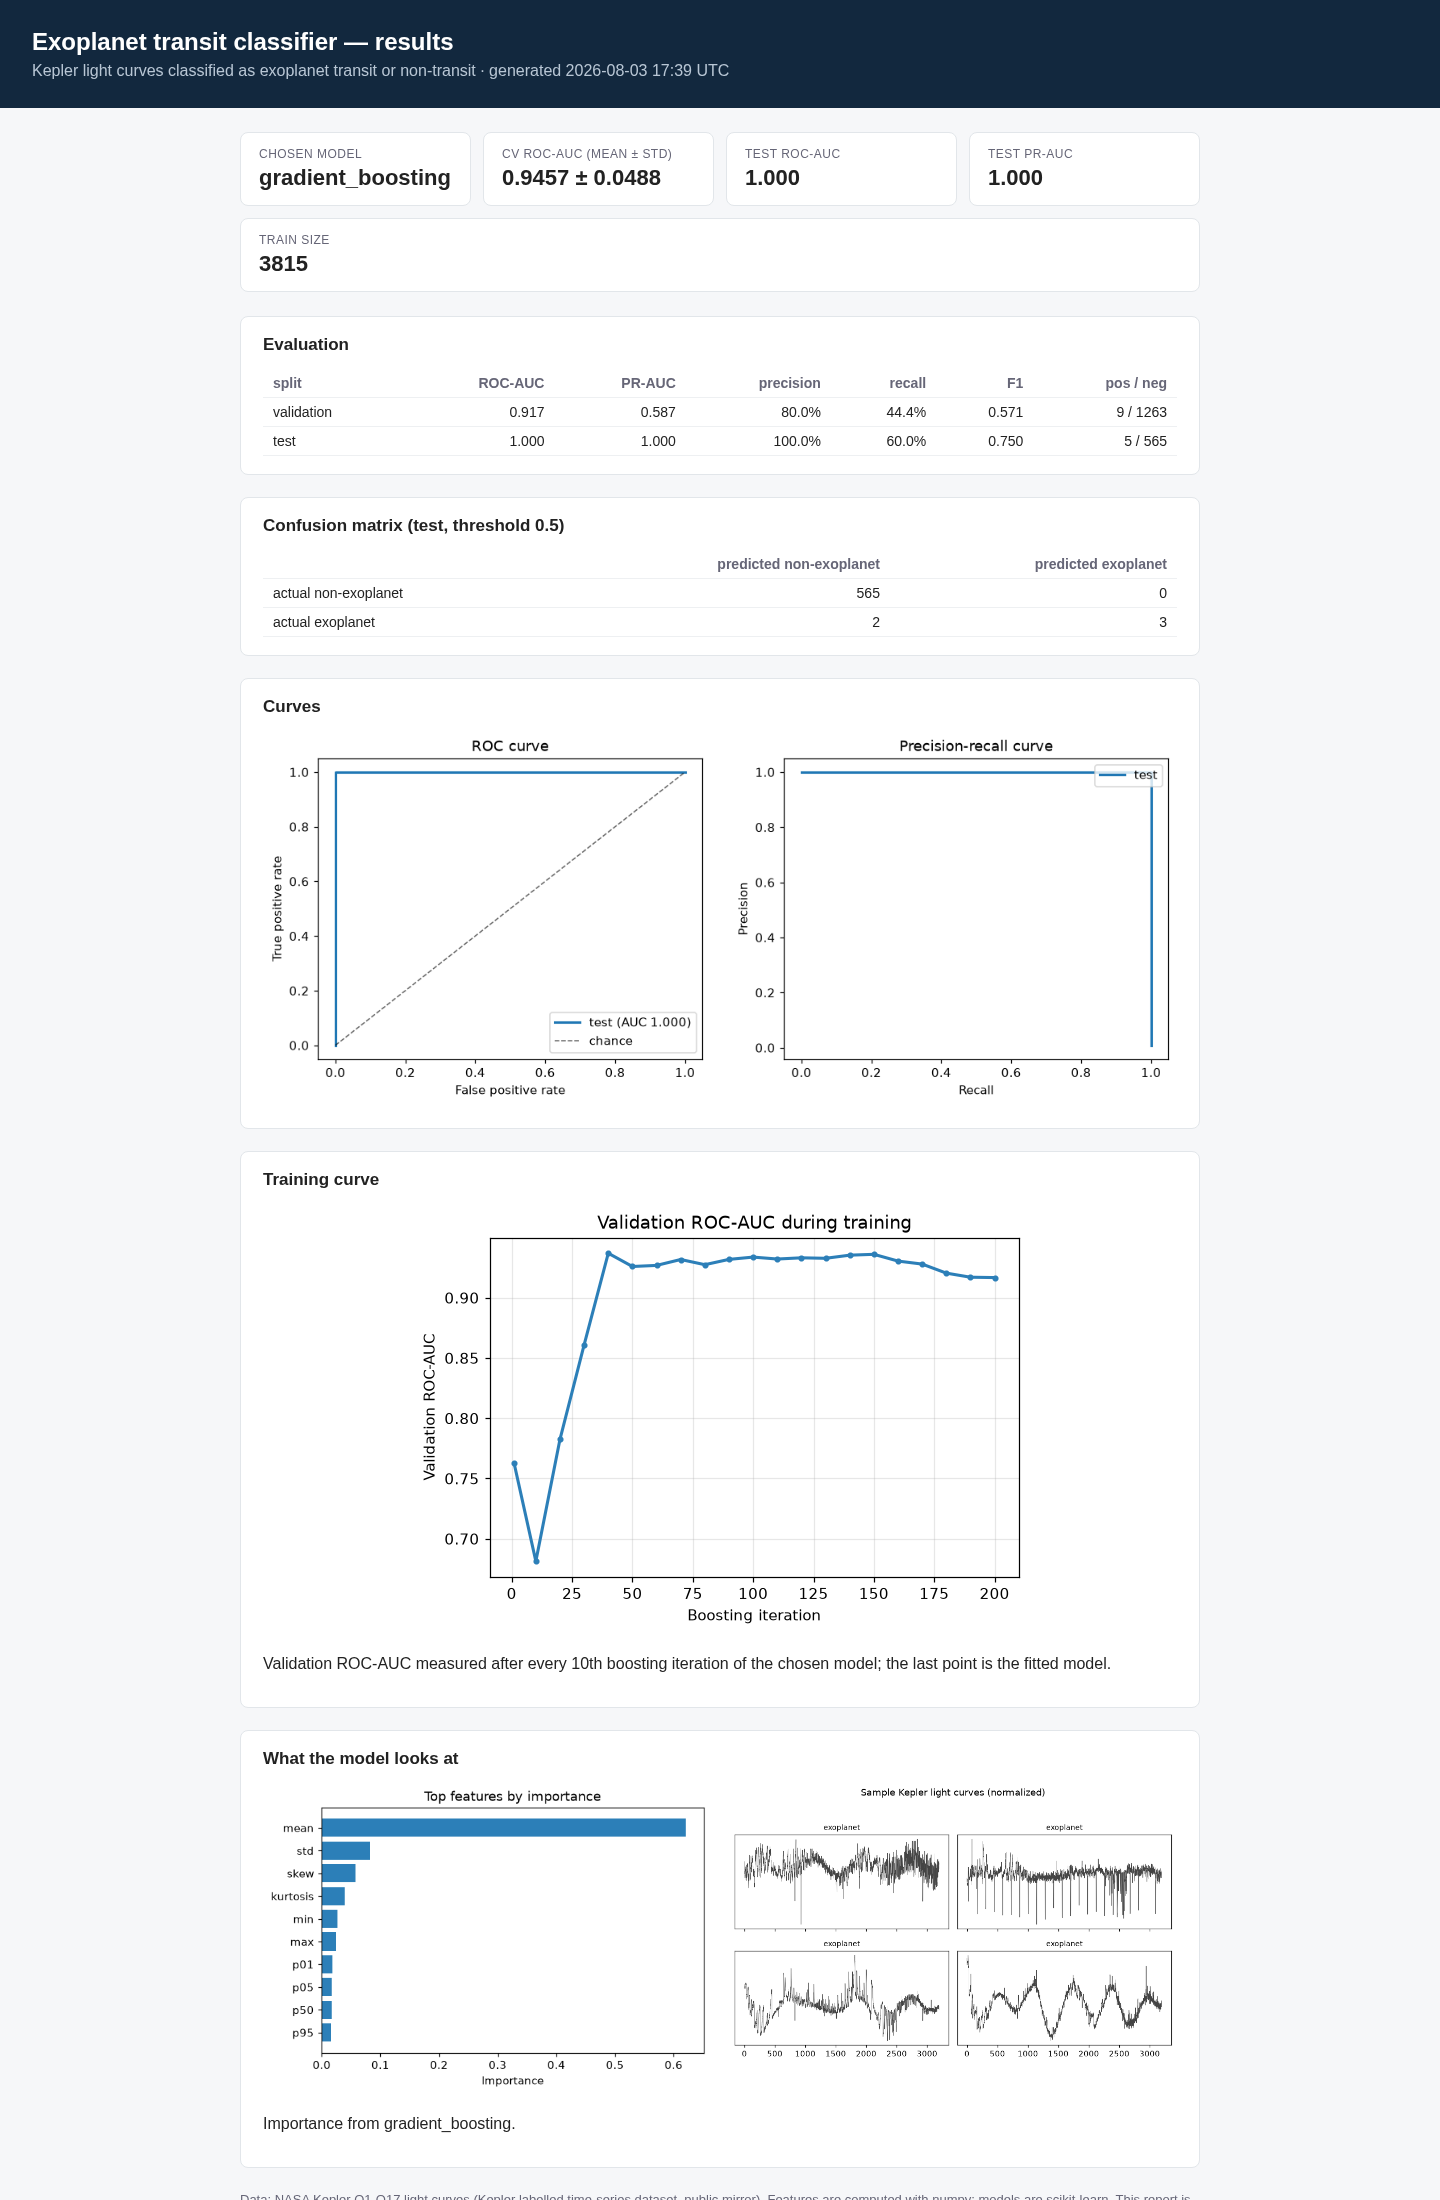
- Artifacts: feature matrices (committed, small), the trained model (gitignored), a metrics JSON, and a self-contained HTML report with ROC / precision-recall curves, feature importance, and sample light curves.
Results
Trained on 5,087 labelled Kepler light curves (3,815 train / 1,272
validation split), scored once on the official 570-curve test set
(5 exoplanets, 565 non-exoplanets). Full details in docs/metrics.json
and the committed report docs/classification-report.html.
| Metric | Validation | Test |
|---|---|---|
| ROC-AUC | 0.917 | 1.000 |
| PR-AUC | 0.587 | 1.000 |
| Precision | 0.800 | 1.000 |
| Recall | 0.444 | 0.600 |
| F1 | 0.571 | 0.750 |
- Cross-validated ROC-AUC: 0.946 ± 0.049 (5 folds, gradient boosting).
- The model never raised a false alarm on the held-out test set (0 false positives out of 565 non-exoplanets) and ranked all 5 true exoplanets above every non-exoplanet (test ROC-AUC 1.0).
- Early versions of the features (raw dip counting without detrending) scored CV ROC-AUC 0.67 — the detrend + autocorrelation grid was the change that took it past 0.94.
Top features by importance: mean, std, skew, kurtosis, min, max, and the tail percentiles — the detrended curve’s shape statistics.
Reproduce
python -m venv .venv && source .venv/bin/activate
pip install -e '.[dev]'

# 1. Build feature matrices from the raw light curves (downloads ~290 MB once)
exo-classifier prepare -c configs/example.yaml

# 2. Train, evaluate, and render the report
exo-classifier train -c configs/example.yaml

# 3. Score new light curves (CSV with a label column, or flux columns only)
exo-classifier predict -c configs/example.yaml new_curves.csv -o predictions.csv

# Tests (hermetic — synthetic light curves, no network)
python -m pytest -q
Project layout
exoplanet-transit-classifier/
├── configs/example.yaml        # all knobs: data paths, split, features, model
├── data/
│   ├── raw/                    # downloaded CSVs (gitignored)
│   └── samples/                # committed gzipped feature matrices + raw sample
├── src/exoplanet_classifier/
│   ├── config.py               # YAML config, validation, path resolution
│   ├── data.py                 # loading, split, feature-matrix export
│   ├── features.py             # detrending + 420 features per light curve
│   ├── model.py                # baseline vs boosting, CV, evaluation
│   ├── report.py               # console summary + self-contained HTML
│   └── cli.py                  # prepare / train / predict / report
├── docs/                       # committed results: metrics.json, HTML report
├── outputs/                    # trained model + predictions (gitignored)
└── tests/                      # 62 hermetic tests